unlock quant UX research
an AI native platform built to accelerate quantitative analysis and make data-driven insights accessible to anyone running UX research.
A replay of an analysis being built on the canvas: columns are dropped in, filtered, and wired into a cross-tabulation and a bar chart, each node computing as its input connects.
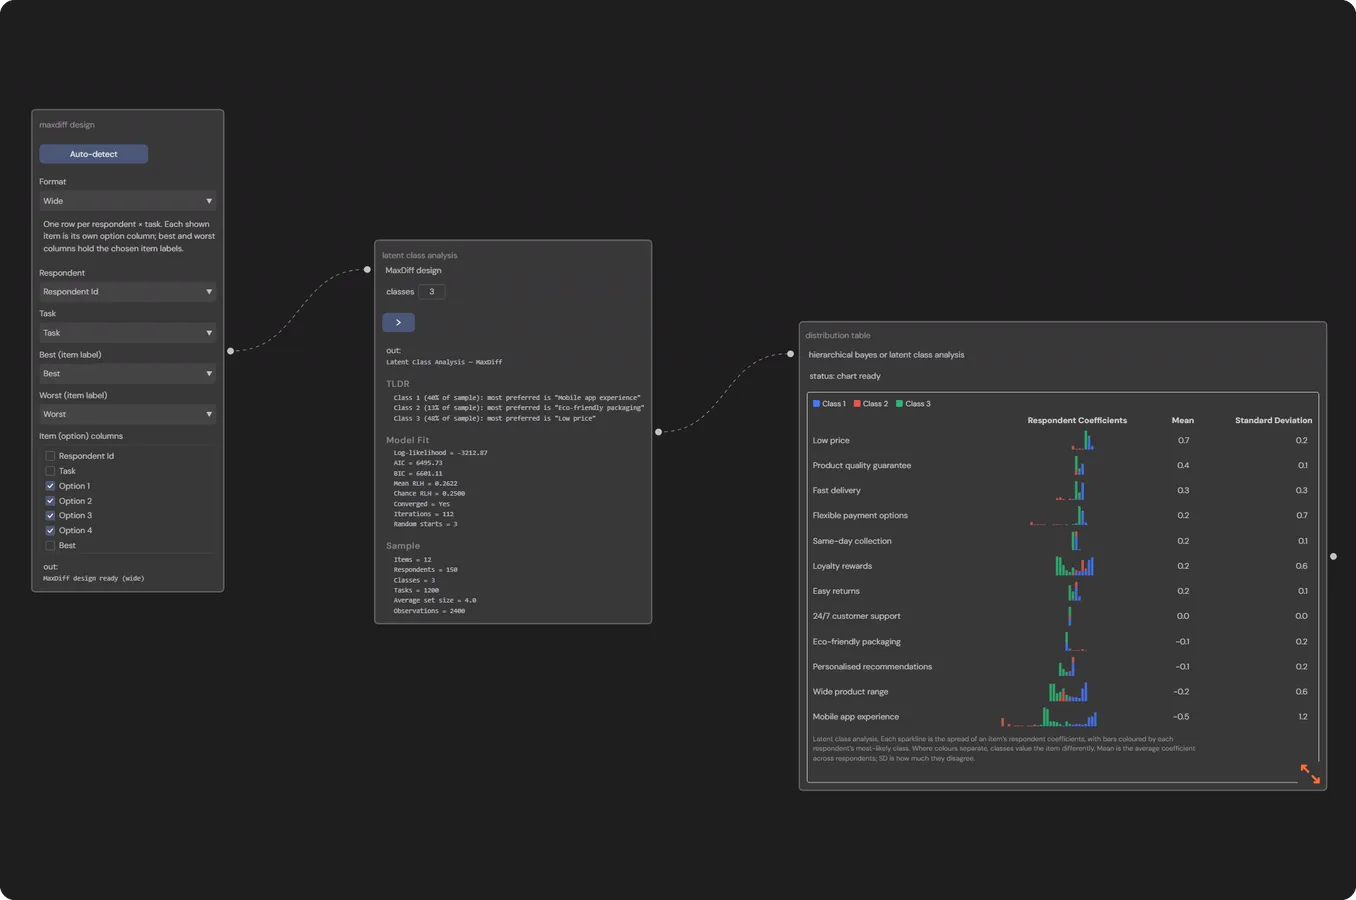
turn data into insights
access a growing library of 80+ tools to test, describe, visualize and transform data.

enhanced by ai
Work alongside an AI that is there to support you with selecting the right approach and interpreting the results.

an easy learning curve
Whether talking to the AI assistant or using the no-code graph editor, you can access advanced tools from day one.

built for speed
dtype's purpose built statistical processing engine is optimized for speed so that you get results fast, even with large datasets.
ai-powered analysis
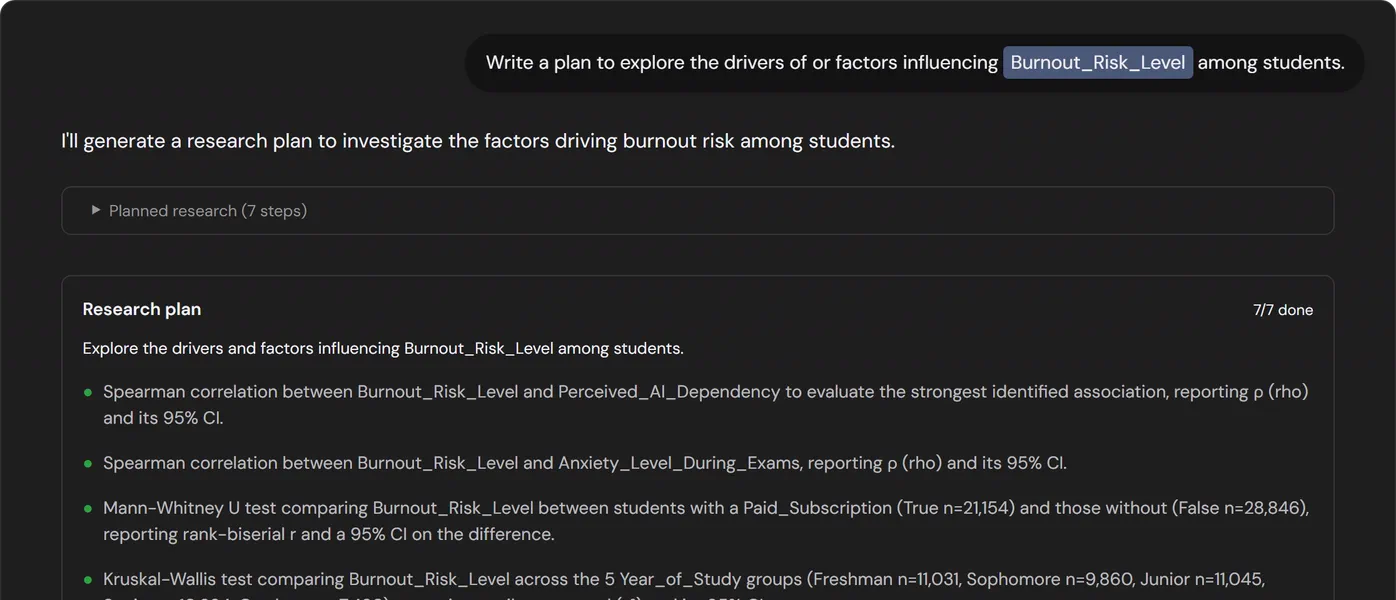
run our full library of tools to test, describe, visualize and transform data by talking to an AI assistant.
A replay of a chat with the analysis agent: a researcher asks questions about a dataset and the agent answers with statistical tests, charts and its working.
- Duplicate rowschecked for rows with identical responses
- Missing valuesidentified any missing or blank values and suggested methods to handle them
- Text consistencychecked for stray whitespace, casing variants and mixed date formats
- Outlierstested for any extremely high or low values that could bias results
- Speederschecked for any respondents finishing far faster than the median completion time
- Straight-liningtested for responses that suggest the respondent was not engaged in the survey
- Category mergescorrected for synonyms and misspellings in categorical data
automated data cleaning
Files can be audited for the issues that bias results — duplicates, missing values, speeders and straight-liners. They can then be automatically cleaned to be ready for analysis.
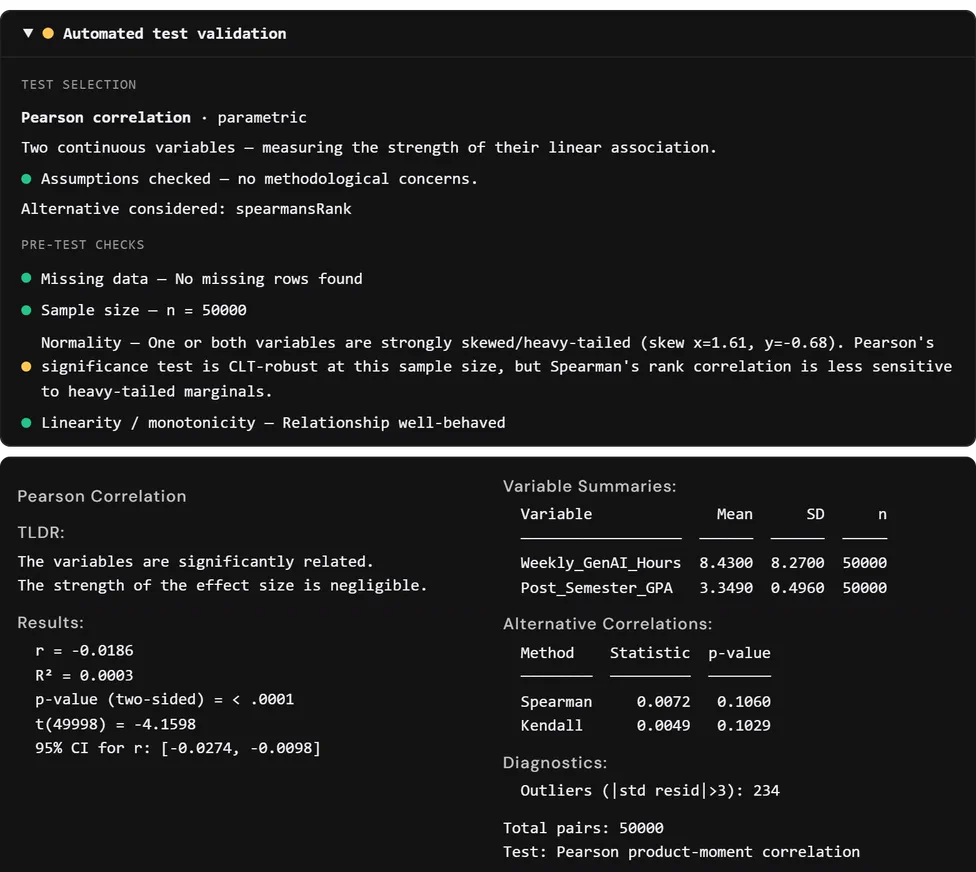
An example validation card: the checks run before a Pearson correlation, showing row counts, the tests that passed, and a warning that both variables are strongly skewed.
test selection auditing
Automated checks of test requirements are run every time the AI agent requests a test. These checks guide the agent to consitently follow best practices. They also allow you to easily monitor agent behaviour, giving you insight into whether assumptions and requirements have been met.
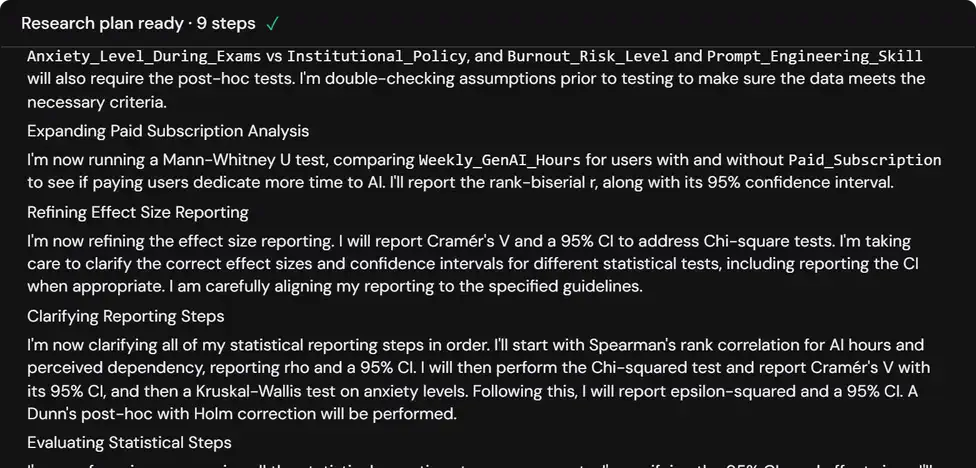
A replay of the planner sub-agent at work: it reasons about the dataset, runs exploratory checks one by one, and finishes with a numbered research plan.
exploratory research planning
You can instruct the agent to formulate a plan for analyzing your data. The agent will conduct exploratory analysis to generate a well-informed plan and then implement the research steps for you.
frequently asked questions
dtype is an AI native platform built to accelerate quantitative analysis. It is designed for anyone who wants to make data driven decisions, from UX researchers to product managers to business leaders. You can test, describe, visualize and transform data either with an AI assistant or using a no-code graph editor.
dtype is built for generative and evaluative UX research, with a focus on speed and ease of use. The workflow is centered on analysis, with the creation of reports as the final step in the process. The backend engine does a lot of automated heavy lifting to convert, encode and transform your data, so that you can stay focused on answering the questions that matter.
Any structured data, such as survey responses, can be analyzed. dtype imports Excel and CSV files.
No, the agentic AI system is purpose built to make running quantitative analysis accessible. Some familiarity with statistics is helpful when working in the graph editor.
Yes, all results can be exported to a Word or PowerPoint file with pro or premium plans. We have a dedicated agent for taking the results of your work and creating a report in PowerPoint.
dtype uses a columnar database built for analytics and a statistical processing engine optimized for speed so that you get results fast, even with large datasets.
No, the graph editor provides a direct way to build analyses without the need for AI.